By Vikas Rohilla | Updated: March 2026 | Reading time: ~9 minutes
Let me be honest with you — when I first heard the term PageSpeed Insights, I had no idea what it meant. I thought it was just another complicated developer tool that I would never need to understand.
I was wrong. Very wrong.
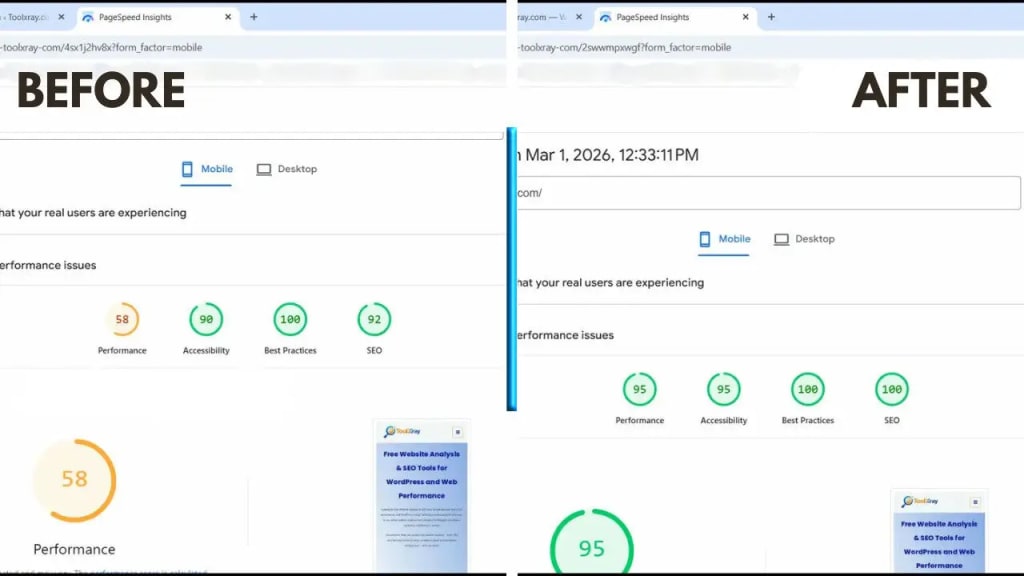
After spending weeks struggling with my WordPress site’s poor Google rankings, I discovered that Google PageSpeed Insights was the single most important free tool I had been ignoring. Once I understood how to actually use it — and act on what it tells you — my mobile score jumped from 58 to 95 in a single day.
In this guide, I am going to walk you through everything. What PageSpeed Insights is, how to run your first website speed test, what the numbers actually mean, and exactly what to fix — step by step. No technical jargon. No assumptions. Just a clear, practical guide for beginners.
Quick fact: Google’s own research shows that 53% of mobile visitors leave a website if it takes more than 3 seconds to load. PageSpeed Insights tells you exactly how long your site takes — and why.
What Is PageSpeed Insights?
PageSpeed Insights (also called Google PageSpeed Insights or simply PSI) is a free tool made by Google that analyzes how fast your website loads — both on mobile and desktop devices.
You give it a URL. It gives you a score from 0 to 100. And more importantly, it tells you exactly what is slowing your site down and how to fix it.
Think of it like a doctor’s checkup for your website. It does not just tell you that something is wrong — it tells you what is wrong, why it matters, and what you should do about it.
There are two types of data Google PageSpeed Insights uses:
- Lab Data — A simulated test run in a controlled environment. This is what you see immediately when you run a test.
- Field Data (CrUX) — Real user data collected from actual visitors to your site over the past 28 days. Only appears once your site has enough traffic.
If your site is new, you will only see Lab Data initially. That is perfectly fine — it is still incredibly useful for improving your site.
Why Does Google PageSpeed Matter for SEO?
This is where it gets serious. Since 2021, Google officially uses Core Web Vitals — which are measured by Google PageSpeed — as a ranking factor. This means your website speed directly affects where you appear in Google search results.
And it gets even more important: Google now uses Mobile-First Indexing. This means Google looks at your mobile site first when deciding your ranking — not your desktop version.
So if your mobile score on PageSpeed Insights is poor, you are likely:
- Ranking lower than your competitors in Google search
- Losing visitors who leave before your page even loads
- Wasting money on ads that send traffic to a slow site
- Missing out on conversions because impatient users go to faster competitors
Personal experience: My site was ranking on page 5 for my target keywords. After improving my PageSpeed Insights score from 58 to 95, I started seeing page 2 and page 3 rankings within weeks — without changing a single word of content.
How to Run Your First Website Speed Test
Running a site speed test with PageSpeed Insights takes less than 60 seconds. Here is exactly what to do:
- Open your browser and go to pagespeed.web.dev
- Type or paste your website URL in the search box (for example: https://toolxray.com)
- Click the blue “Analyze” button
- Wait 30 to 60 seconds for the analysis to complete
- Make sure you click the “Mobile” tab to see your mobile score — this is the one that matters most for SEO
Which Pages Should You Test?
Most people only test their homepage. That is a mistake. Every important page on your site can have a different score. You should run a website speed test on:
- Your homepage
- Your most important blog posts or product pages
- Your contact page or landing pages
- Any page you are trying to rank in Google
I also recommend using ToolXray alongside Google PageSpeed Insights. ToolXray gives you a complete technical SEO audit — including speed, server health, Core Web Vitals, and WordPress-specific issues — all in one free report.
Understanding Your PageSpeed Insights Score
When your Google PageSpeed test finishes, you will see a large number in a colored circle. Here is what the colors and numbers mean:
| Score | Rating | What It Means |
| 90 – 100 | Good | Excellent! Your site loads fast. Google loves it. |
| 50 – 89 | Needs Improvement | Visitors may notice slowness. Some fixes needed. |
| 0 – 49 | Poor | Serious problems. Google is penalizing your ranking. |
But here is something important to understand: the PageSpeed Insights score is not the only thing that matters. The individual metrics below the score are what actually affect your users and your ranking.
The 5 Core Web Vitals Metrics Explained Simply
When you scroll down in your Google PageSpeed Insights report, you will see five key metrics. Here is what each one means in plain English:
1. LCP — Largest Contentful Paint

This measures how long it takes for the biggest visible element on your page — usually your hero image or headline — to fully load.
Good score: Under 2.5 seconds Poor score: Over 4 seconds
LCP is probably the most important metric. My site had an LCP of 11 seconds when I first ran the site speed test. That meant visitors were staring at a blank screen for 11 seconds. Of course they were leaving!
2. FCP — First Contentful Paint
This measures how long it takes for the very first piece of content — any text, image, or element — to appear on screen. FCP tells you when users first see something rather than a blank white page.
3. TBT — Total Blocking Time
This measures how long JavaScript blocks the main thread and prevents users from interacting with your page. A high TBT means users can see your page but cannot click anything. Very frustrating! Aim for under 200ms. My site now sits at 0ms — achieved by properly deferring JavaScript loading.
4. CLS — Cumulative Layout Shift
Ever been reading a page and suddenly everything jumps around? That is layout shift. CLS measures how much your content unexpectedly moves while loading. It is incredibly annoying for users and Google penalizes it. Aim for under 0.1.
5. Speed Index
This measures how quickly the contents of your page visually fill in. A lower number is better. Think of it as how “complete” your page looks during loading — not just when it is fully loaded.
Pro tip: When reading your PageSpeed Insights report, focus on LCP and TBT first. These two metrics have the biggest impact on both user experience and Google rankings.
Reading the Insights Section — What to Actually Fix
Below your scores and metrics, Google PageSpeed Insights shows you a section called “Insights” — this is where the real gold is. It lists specific problems on your site ranked by how much time they could save.
Here are the most common issues you will see and what they actually mean:
Render-Blocking Requests
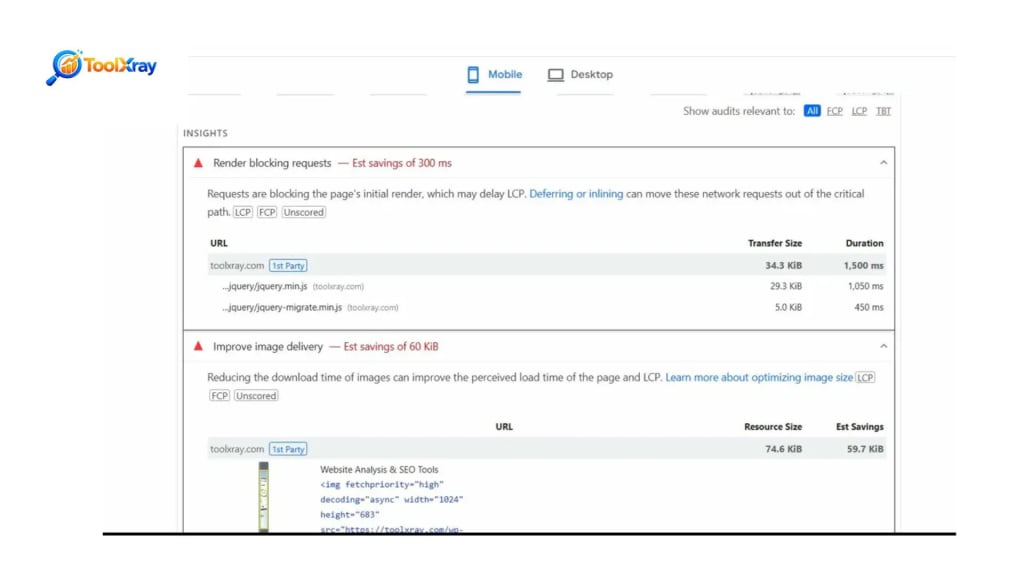
This is the most common issue on WordPress sites. It means certain CSS or JavaScript files are loading before your page can even start displaying content. On my site, this single issue was causing a 2,710ms delay. The fix is to load these files asynchronously — a caching plugin like LiteSpeed Cache can handle this automatically.
Improve Image Delivery
This means your images are too large, in the wrong format, or not sized correctly for mobile screens. PageSpeed Insights will tell you exactly which images are the problem and how many KiB (kilobytes) you could save by fixing them. The solution is to convert images to WebP format and compress them. I use Squoosh.app — it is completely free.
Reduce Unused CSS / JavaScript
WordPress sites often load CSS and JavaScript for every plugin on every page — even when those plugins are not actually used on that specific page. This wastes bandwidth and slows down your site speed test results. Tools like QUIC.cloud can generate page-specific CSS (called UCSS) that strips out unused rules automatically.
How I Improved My PageSpeed Insights Score from 58 to 95
I want to share the exact steps I took, because I know how overwhelming it feels to look at a PageSpeed Insights report full of red warnings for the first time.
Step 1: Installed and Configured LiteSpeed Cache
Most people install this plugin and leave all settings on default. That does almost nothing. The settings that actually made a difference for my Google PageSpeed score:
- CSS Minify and Combine: ON
- Load CSS Asynchronously: ON (after QUIC.cloud setup)
- Load JS Deferred: Deferred (NOT Delayed — breaks mobile menus!)
- Font Display Optimization: Swap
Step 2: Connected QUIC.cloud for Smart CSS
QUIC.cloud is LiteSpeed’s free service that generates Unique CSS (UCSS) for each page — removing unused styles automatically. This alone brought my unused CSS from 198 KiB down to near zero. Without this step, my Google PageSpeed Insights score could not break past 80.
Step 3: Fixed Hero Image
My hero image was 74 KiB and serving at 1024 pixels wide on a mobile screen that only needed 768 pixels. I used Squoosh.app to convert it to WebP at 75% quality and resize it to 768px. The result: same visual quality, 80% smaller file. My LCP dropped from 11 seconds to under 2 seconds after this change alone.
Step 4: Run Force Cron After Every New Post
This is the step nobody tells you. Every time I publish a new blog post, I go to LiteSpeed Cache Dashboard and click “Force cron” on Critical CSS, Unique CSS, and Viewport Image. If I skip this, my PageSpeed Insights score drops because the new page’s images and CSS are not processed yet. I learned this the hard way when my score dropped from 95 to 58 overnight after publishing a new article.
Common Mistakes Beginners Make with PageSpeed Tests
Mistake 1: Only Testing Desktop
The Mobile tab in Google PageSpeed Insights is what matters for SEO. Desktop scores are almost always 15 to 25 points higher because they simulate a faster network and device. Always check your mobile score first.
Mistake 2: Chasing a Perfect 100 Score
I see beginners obsess over getting 100/100 and break their sites trying to squeeze out the last few points. Here is the truth: a score of 85+ on mobile is excellent. Most successful websites score between 75 and 90. Anything above 90 is world-class. Do not sacrifice functionality for a number.
Mistake 3: Ignoring Score Fluctuations
Your website speed test score will vary between runs — sometimes by 5 to 10 points — because Google’s testing servers have variable loads. Run the test 3 times and average the results. A single test result is not reliable enough to make decisions from.
Mistake 4: Not Testing After Changes
Every time you install a new plugin, change your theme, or add new content, run PageSpeed Insights again. Plugins especially can dramatically slow down your site — even “lightweight” ones can add significant CSS and JavaScript that hurts your score.
Free Tools to Use Alongside PageSpeed Insights
Google PageSpeed Insights is powerful, but it works best when combined with other free tools:
ToolXray — Full Technical SEO Audit
ToolXray.com gives you everything PageSpeed Insights gives you — plus WordPress theme detection, server health analysis, technical SEO audit, and more. It is free, takes 10 seconds, and requires no signup.
I use ToolXray as my first step when auditing any site. It gives me a complete picture before I dive into the detailed Google PageSpeed report. Check your site at toolxray.com.
Google Search Console
Google Search Console has a dedicated “Core Web Vitals” report that shows real user data — not just lab simulations. Once your site gets enough traffic, this becomes more valuable than individual site speed test runs because it reflects what actual visitors experience.
GTmetrix
GTmetrix is another free website speed test tool that complements PageSpeed Insights. It shows you a detailed waterfall chart of every resource loading on your page — useful for identifying which specific files are causing slowdowns.
What Is a Good PageSpeed Insights Score in 2026?
People ask me this constantly. Here is my honest answer based on real-world experience:
- 90–100: World-class. You are in the top 5% of websites. Almost impossible to achieve with complex WordPress sites using page builders.
- 80–89: Excellent. Google is happy. Your users are happy. This is a great target for most WordPress sites.
- 70–79: Good. Noticeable by some users on slow connections. Some optimization needed.
- 50–69: Needs work. You are likely losing rankings and visitors. Prioritize fixing render-blocking resources and images.
- Below 50: Poor. This is actively hurting your business. Make speed optimization your number one priority.
Reality check: The average WordPress site with Elementor scores between 60 and 75 on mobile without optimization. Getting above 85 with Elementor is genuinely impressive — it is the result of careful, intentional optimization, not just installing a plugin.
Final Thoughts — Start With PageSpeed Insights Today
PageSpeed Insights is not just a vanity tool. It is a direct window into how Google sees your website and how your users experience it.
The good news is that you do not need to be a developer or spend any money to dramatically improve your Google PageSpeed score. The fixes I described in this guide — proper caching configuration, image optimization, and CSS cleanup — are all achievable with free tools in an afternoon.
Here is your action plan for today:
- Go to pagespeed.web.dev and run your first website speed test
- Note your mobile score and write down the top 3 issues shown in the Insights section
- Run a full technical audit at toolxray.com to get the complete picture
- Fix the biggest issue first — usually render-blocking resources or oversized images
- Re-run the Google PageSpeed Insights test to measure your improvement
Speed is not optional in 2026. It is a ranking factor, a user experience factor, and a revenue factor. The sites that invest in performance today are the ones that dominate search results tomorrow.
Start your site speed test right now. Your future rankings depend on it.